
After a quick analysis of the current Republic of Ireland u17 squad for the European Championships (being held in May 2019) resulted in much discussion on twitter regarding implications and recommendations, I decided to expand that analysis by looking at every squad in the tournament (and providing this very brief overview!).
What team and players?
Sixteen teams qualified for the finals of the tournament. Listed on the official tournament programme are the players who had played more than 2 qualifying games for each of the 16 teams (thus might vary slightly from final panels). This was a total of 344 players. The number of players used per squad varied from 26 (Spain) to 15 (England).
Year born?
The vast majority of the players were born in 2002. There were 14 2003s, with Iceland having the most with 3 players born in 2003, with Spain, Czech Republic, Greece and the Netherlands having played 2 2003s throughout their qualifying campaign. These players were predominantly midfielders and forwards (but did include 3 defenders).
What is the Relative Age Effect?
The relative age effect (RAE) refers to a preference for selecting athletes born earlier in the age-band due to enhanced maturational factors (Baxter-Jones, 1995). A child with a chronological age of 12 years may possess a biological age of between 9 and 15 years (Borms, 1986). Grondin, Deshaies and Nault (1984) first identified the relationship between birth date and success in their study of the National Hockey League where they identified an over representation of players born at the start of the year which they attributed to the 1st January cut-off date used in hockey. Youth born early can have participation and performance advantages compared to youth born later in the age bands.
Players advanced in biological maturity generally perform better than those that are less advanced (Beunen et al., 1988; Malina et al., 2004), which can lead to a systematic exclusion of later maturing boys within team sports (Ostojic et al., 2014; Philippaerts, et al., 2006). The advanced physical (Gaston & Bennet, 2014; Gil et al., 2013; Delorme & Raspaud, 2009; Malina, Bouchard, & Bar-Or, 2004), cognitive (Jimenez & Pain, 2008; Bisanz, Morrison, & Dunn, 1995) and social (Dhuey & Lipscomb, 2008; Thompson et al., 2004) development of these older players can lead to increased propensity for this relatively older population to be chosen for representative squads and teams. Using these factors as markers for potential future performance can result in a biased view of potential and can facilitate recruitment into advanced teams or structures for earlier maturing individuals (Delorme, et al., 2010). A focus on short term success over longer term development can lead to a selection bias towards those players born earlier in the year, thus creating unfair advantages within a development system, as these advantages are perpetuated throughout the key developmental stages of a youth athlete (i.e. through access to better coaching facilities, higher competition and exposure to scouts). You can read more about it here.
Why is constructed in quarters?
To allow for ease of analysis and cross-study comparisons, the 12 months of the year are collapsed into 4 quarters. The 3 months immediately after the selection cut-off date are known as quarter 1 (i.e. January, February, March), quarter 2 comprises of April, May, June, quarter 3 is July, August, September, finally quarter 4 represents the end of the year (October, November, December).
Dates of birth
As you can see below, 47% of players who represented teams at the u17 European Championships were born in the 1st 3 months of the year, with 6% comprising the final quarter. When broken down, this is 57 players born in January down to a low of 3 players born in December.


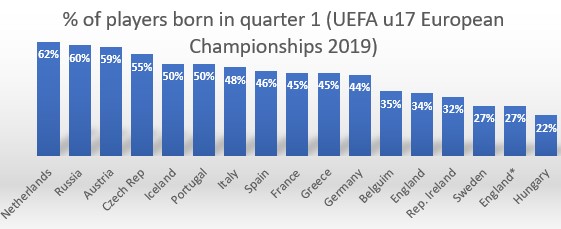
Do all squads have a similar make-up?
As can be seen below, the range of early born players within each squad varies. The Netherlands (who are the reigning champions at u17 level) display one of the largest recorded percentages of quarter 1 births seen in youth football research, with 62% of their players being born in the first 3 months of the year.

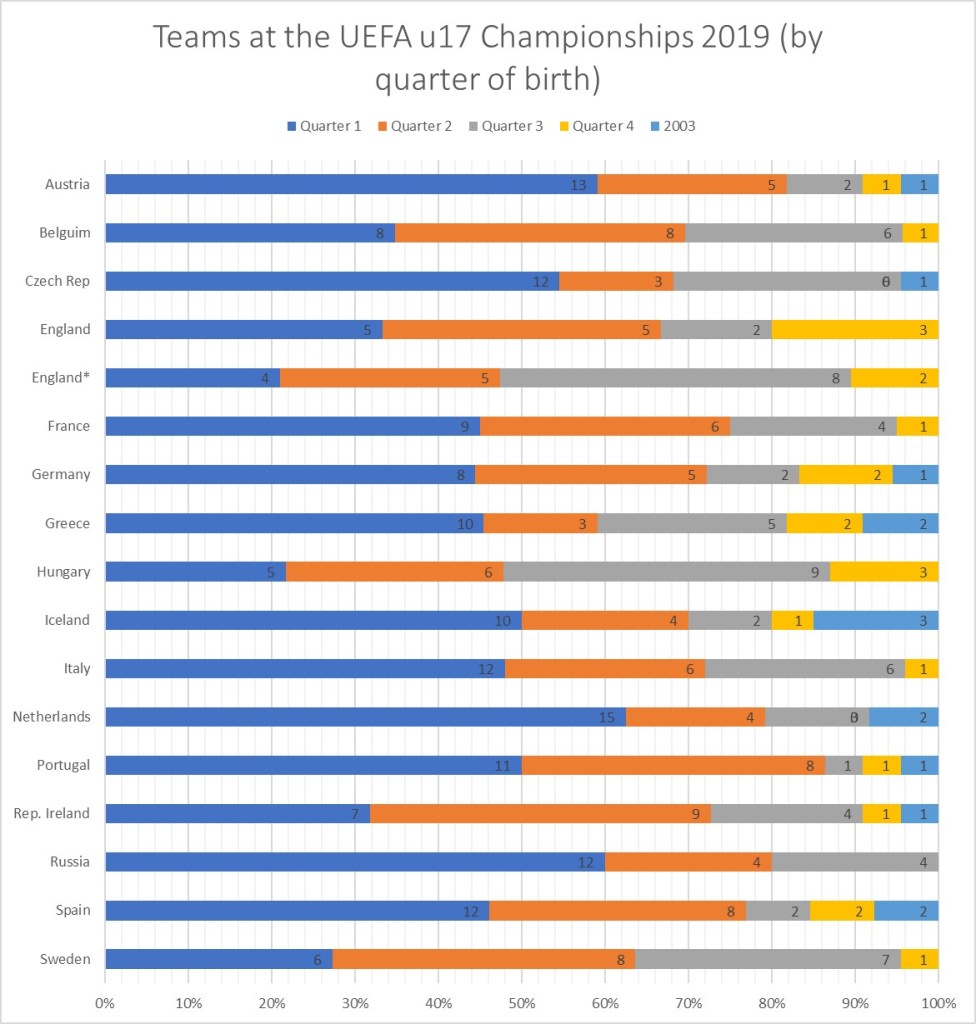
Why are there 2 England inclusions?
English youth leagues and academies run a different cut-off date to other European nations (September 1st v January 1st). Due to this, a high volume of births of academy players are usually seen in the months of September, October and November. This can often skew general RAE research by bumping up the number of players in quarter 3 and 4. So out of interest, ‘England’ is the regular comparison to other European countries using Jan 1st as the start of the year, while ‘England*’ relates to their tournament squad (hence why there are a few extra players, but I’ve exclude one player who didn’t go through the UK development pathway) using Sept 1st as the start of the year.
The breakdown of quarters from all countries can be seen below (with a 5th section for 2003s).
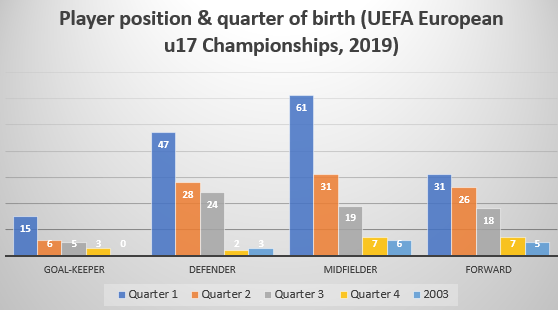
Does it vary by position?
Consistent with other research, defenders have a strong RAE. Midfield shows a significant RAE in this analysis. Research on midfielders can vary, with it showing the greatest RAE in most European leagues, except Premier league where it was the only position which was not affected by the RAE (again this could be due to the skewing of data), whereas in the Bundesliga the opposite effect occurred, as the position of midfielder was the only one which showed the RAE (Salinero et al. 2013). RAE was only present in forwards in the Premier League (Salinero et al. 2013). The impact is somewhat lesser in forwards than other positions in this study. Often positional RAE is impacted by culture, style of play, tactics etc and varies within positional groups (i.e. central defender v full-back).
So what?
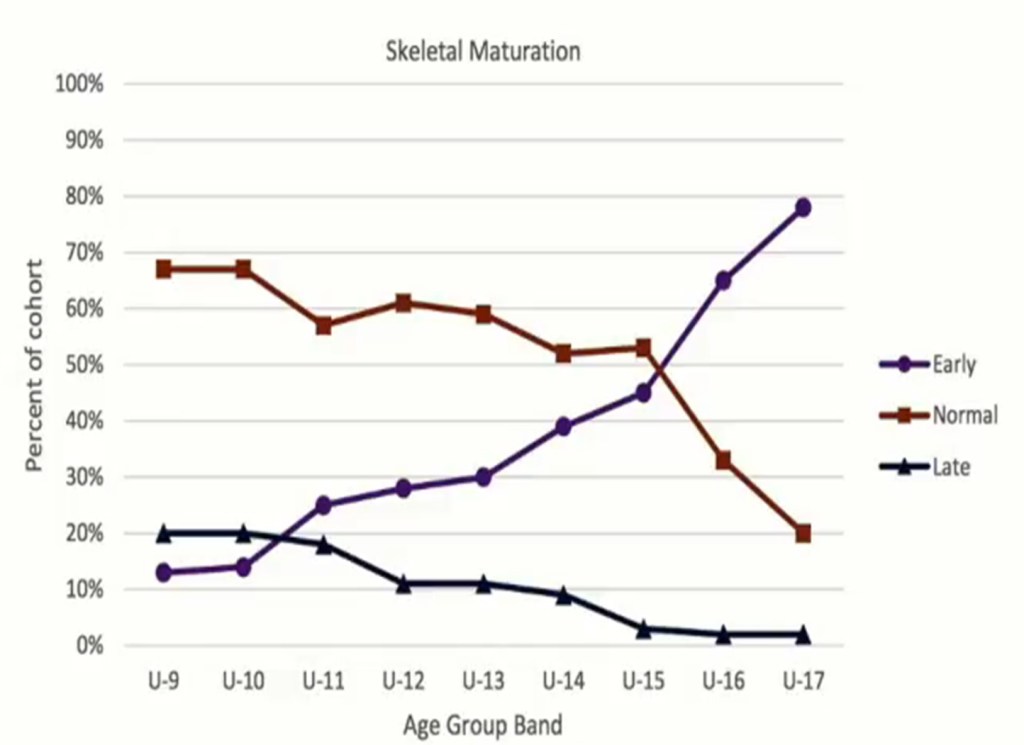
Youth football has an issue with physicality biasing perceptions of potential. The discussion regarding RAE is a lot more complex than purely dates of birth. Being born in quarter 1 (January, February, March) doesn’t mean you are necessarily more physically mature than an athlete born in quarter 4 (October, November, December) and indeed there are many January borns who are late maturing and many December borns who are early maturing. Recent research has shown that physical maturity was not related to enhanced physical maturity. While early maturing players may gain initial selection and training advantages (Johnson et al. 2017), a danger exists where he/she may rely on physical dominance, perhaps not diversifying skills or not experiencing any ‘rocky road’ (Collins & McNamara, 2012) in development and can be overtaken when others catch up (if anyone else has managed to stay in the system!). Below is a graph of Man Utd and Aspire academy research on biological maturity of players).
Added this to the RAE reversal which is seen in some professional leagues (where the difference in numbers between quarters narrows or sometimes disappears), it is quite a complex discussion which needs input from all stakeholders in development (the athlete themselves, Governing Body, administrators, coaches, parents). Thus, the wider discussion should be focused not on when someone was born but on how to provide adequate challenge and opportunities for all. How can we ensure enough initial opportunities for later maturers on development pathways, yet also challenge our early maturers technically and tactically.

How to reduce?
There is no silver bullet. Potential strategies must be relevant and applicable to the context. Early competitive structures can drive up the RAE so Governing bodies should reflect on their structures, also consider how flexible those structures are. For example, is playing up or down an option? Both can be effective if managed carefully. Commit to implementing strategies to try to reduce the potential drop-out and narrowing of talent pools (enforcing quotas have been trialed, rotating cut-off dates, supporting complementary strategies e.g. average age tournaments). Keep as many players in the talent pool as possible and give as many opportunities as possible. Is awareness of the impact of maturation a component on coach education programmes? Awareness helps to reduce the impact of RAE and a separate emphasis on maturation.
Thank you for reading this short snippet of RAE literature! You can contact me via email on laurafinnegan82@yahoo.co.uk and I’ll be happy to chat more!
References:
- Baxter-Jones, A., 1995. Growth and development of young athletes: Should competition levels be age related?. Sports Medicine, Volume 20, pp. 59-64.
- Beunen, G., Malina, R., Van Hof, M. & Simons, J., 1988. Adolescent growth and motor performance: A longitudinal study of Belgian boys. Champaigh, IL: Human Kinetics.
- Bisanz, J., Morrison, F. J. & Dunn, M., 1995. Effects of age and schooling on the acquisition of elementary quantitative skills. Developmental Psychology, Volume 31, pp. 221-236.
- Borms, J., 1986. The child and exercise: An overview. Journal of Sport Sciences, Volume 4, pp. 3-20.
- Collins, D., and MacNamara, Á (2012). The rocky road to the top: why talent needs trauma. Sports Med. 42, 907–914. doi: 10.1007/BF03262302
- Delorme, N. & Raspaud, M., 2009. The relative age effect in young French basketballers: A study on the whole population. Scandanavian Journal of Medicine and Science in Sports, Volume 19, pp. 235-242.
- Delorme, N., Boiché, J., & Raspaud, M. (2010). Relative age effect in elite sports: Methodological bias or real discrimination? European Journal of Sport Science, 10(2), 91–96. doi: 10.1080/17461390903271584
- Dhuey, E. & Lipscomb, S., 2008. What makes a leader? Relative age and high school leadership. Economics of Education Review, Volume 27, pp. 173-183.
- Gil, S. ., Badiola, A., Bidaurrazaga-Letona, I., Zabala-Lili, J., Gravina, L., Santos-Concejero, J., … Granados, C. (2013). Relationship between the relative age effect and anthropometry,maturity and performance in young soccer players. Journal of Sport Sciences, 1–9. http://doi.org/10.1080/02640414.2013.832355
- Grondin, S., Deshaies, P. & Nault, L., 1984. Trimestres de naissance et participation au hockey et au volleyball.. La Revue Quebecoise de l’Activite Physique, Volume 2, pp. 97-103.
- Johnson, A., Farooq, A. & Whiteley, R. (2017) Skeletal maturation status is more strongly associated with academy selection than birth quarter,Science and Medicine in Football, 1:2, 157-163, DOI: 10.1080/24733938.2017.1283434
- Jimenez, I. P., & Pain, M. T. (2008). Relative age effect in Spanish association football: Its extent and implications for wasted potential. Journal of Sports Sciences, 26(10), 995–1003. doi: 10.1080/02640410801910285
- Malina, R., Bouchard, C. & Bar-Or, O., 2004. Growth, maturation and physical activity. Champaign, IL: Human Kinetics.
- Malina, R., Bouchard, C. & Bar-Or, O., 2004. Growth, maturation and physical activity. Champaign, IL: Human Kinetics.
- Ostojic, S.M., Castagna, C., Calleja-González, J., Jukic, I., Idrizovic, K. & Stojanovic, M. (2014) The Biological Age of 14-year-old Boys and Success in Adult Soccer: Do Early Maturers Predominate in the Top-level Game?, Research in Sports Medicine: An International Journal, 22:4, 398-407, DOI: 10.1080/15438627.2014.944303
- Philippaerts, R. et al., 2006. The relationship between peak height velocity and physical performance in youth soccer players. Journal of Sports Sciences, 24(3), pp. 221-230.
- Salinero, J., & Pérez, B., & Burillo, P., & Lesma, M. (2013). Relative age effect in european professional football. Analysis by position. Journal of Human Sport and Exercise, 8 (4), 966-973.
Thompson, A., Barnsley, R. & Battle, J., 2004. The relative age effect and the development of self-esteem. Educational Research, 46(3), pp. 313-320.

Pingback: Why Generalists Triumph in a Specialized World with David Epstein, NYT bestselling author of Range and The Sports Gene - Changing the Game Project
Pingback: Podcast: Why Generalists Triumph in a Specialized World with David Epstein, NYT bestselling author of Range and The Sports Gene | CAM Dean
Pingback: Children Compete, Adults Compare | footblogball
Pingback: Analyse historique des meilleurs athlètes en patinage de vitesse du Saguenay-Lac-Saint-Jean depuis l’an 2000 – Rémi Beaulieu B.Sc.
Pingback: “Men are from Q1, Women are from…?” Relative Age Effect in female football | Talent development in Irish football
Pingback: #114 Why Generalists Triumph in a Specialized World with David Epstein, NYT bestselling author of Range and The Sports Gene - WorkMojo
Pingback: #245: NYT Bestselling Author David Epstein: Why Generalists Triumph in a Specialized World (replay) - Changing the Game Project